Husky Hunt - Visualizing 1st Place!
linux mobile-dev show-and-tell Last November I participated in my third Northeastern Husky Hunt, this time with the aid of our team’s homebrew’ed app PawPrints. HuskyHunt is a continuous 24-hour scavenger hunt (+ more) around Boston (and often the greater Boston area). Best part was - we won first!
![]()
Pawprints is a React Native mobile app + a React webapp (originally created by my teammate Daniel Goldstein) that work together to organize, track, and automatically sort our clue submissions into Google Drive folders. Pawprints uses player’s smartphones to track them throughout the hunt and relay that to our the people in “HQ”. The app also tracks the status of each clue (completed/uncompleted), as well as the category of clue it falls into.
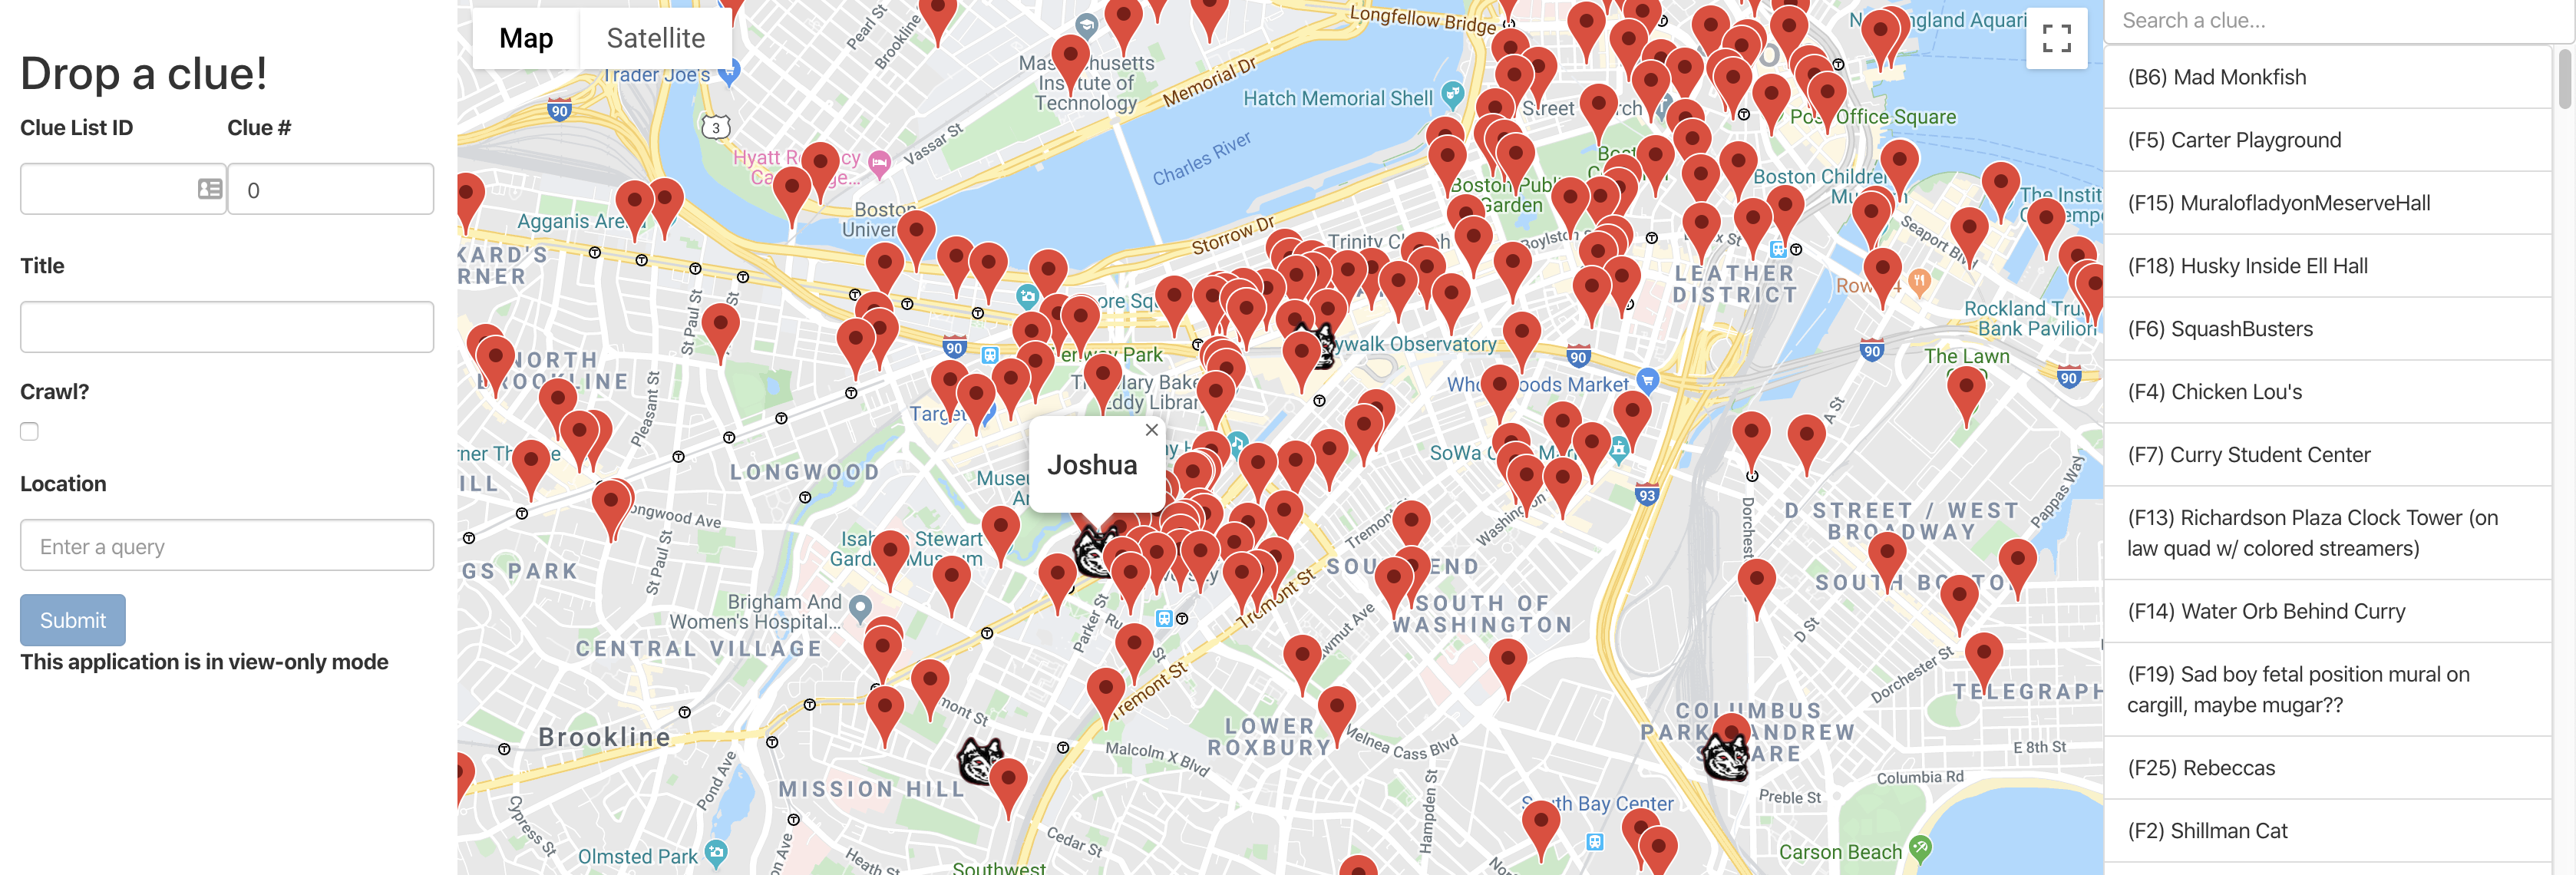
To give ourselves and other players a peek into what it takes to get first place, I decided before the hunt to take 10 minute snapshots of our current state (player location, clue entry, and clue completion status). The below script was run on an ec2 instance as a cron job during the hunt.
#!/bin/sh
/usr/local/bin/firebase --project pawprints-2019 --token $TOKEN database:get / >> /home/ubuntu/backups/`date --iso-8601=second`.json

cd /home/ubuntu/backups
git pull origin master --no-edit
git add .
git commit -m "commit `date --iso-8601=second`"
git push origin master
I’ve posted the raw json on GitHub in the data folder for anyone to explore. That repo also hosts an ipython doc visualizing some interesting HH stats! I’ve begun plotting various visualizations related to average clue completion time, and average solve time.
The data is structured by clues and hunters like so:
{
  "clues": {
    "-LsdNhXj6qJlPLYiuepX": {
      "clueListId": "A",
      "clueNum": "24",
      "completed": false,
      "inCrawl": false,
      "latitude": 42.3264873,
      "longitude": -71.06871920000003,
      "title": "Clifford Playground"
    },
    "-LsdNiaE9045XJfZvIEM": {
      "clueListId": "A",
      "clueNum": "14",
      "completed": true,
      "inCrawl": false,
      "latitude": 42.34740159999999,
      "longitude": -71.09440940000002,
      "title": "Lucky Strike"
    },
    "-LsdNj0yBjKd64AcpXwH": {
      "clueListId": "A",
      "clueNum": "2",
      "completed": true,
      "inCrawl": false,
      "latitude": 42.3417467,
      "longitude": -71.08717969999998,
      "title": "Two Saint's Tavern"
    },
    "-LsdNpTDFEOqpHQj98Em": {
      "clueListId": "A",
      "clueNum": "4",
      "completed": true,
      "inCrawl": false,
      "latitude": 42.34511949999999,
      "longitude": -71.08629229999997,
      "title": "Mapparium"
    },
    "-LsdNzVhGdisruIsX42f": {
      "clueListId": "A",
      "clueNum": "5",
      "completed": true,
      "inCrawl": false,
      "latitude": 42.339381,
      "longitude": -71.09404799999999,
      "title": "MFA Back Entrance"
    }
  },
   "hunters": {
    "Joshua Spicer": {
        "latitude": 42.34018089204072,
        "longitude": -71.08914416285128
    },
    "Daniel Goldstein": {
        "latitude": 42.34694677537695,
        "longitude": -71.08022139159152
    }
  }
My first visualization measured the amount of clues completed at each x inverval. You can see clear breaks where new clue lists were released, and our team all headed back to HQ to decode. These breaks are followed by huge spikes where bike teams poured into Boston. You can see the giant spike toward the end marking our bike team’s “last hurrah” throughout the city.
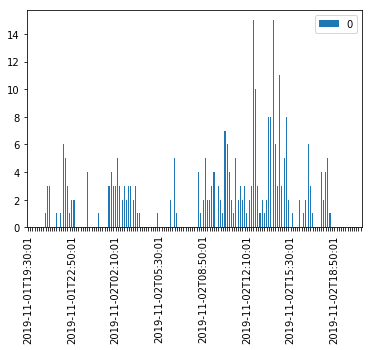
I think there is so much to learn from this data, and i’m really excited to get to play with it more.
Have a comment? Join the discussion
This post helpful? Buy me a coffee!