LLVM Compiler Opt Pass (tips & tricks)
tips-tricks LLVM is super cool and incredibly powerful. For my compilers course this past semester, we had to implement an optimization pass on LLVM IR to remove trivially dead code.
Our pass took a snippet of C code (like seen below) and identified the dead lines of code (the lines that contribute nothing to the result).
int foo() {
int a = 7;
int b = a + 2;
int c = b - a; // dead
int d = c / a; // dead
return b;
}
Using a well-known liveness/data-flow algorithm, dead variables can be computed, and subsequently removed from the LLVM IR. The algorithm involved building up sets (which I stored as LLVM::BitVector) to represents each variable’s uses, definitions, successors. Those could be used to iteratively generate and understand the data flow (the inSets and outSets), which iteratively uncovered code that was trivially dead. Using the LLVM API, lines of the LLVM IR could be removed from the source. This process would be run until convergence, at which point we’ve (hopefully) eliminated all the dead code!
out[n] = ∪ in[s]
in[n] = use[n] ∪ (out[n] – def[n])
Throughout this project I learned a lot about C++ development, as well as interfacing with a powerful framework such as LLVM. Below are some tips i’ve gathered while working through this assignment!
Parsing out the name of an LLVM Value
The LLVM IR assigns virtual registers to instructions sequentially as needed. As a result, you can’t simply get the name of an instruction (using i->getName(), generally returned nothing, or <badref>). The assignment required we capture those instruction names to do further calculation. The workaround is to utilize llvm’s ostream class. To print the virtual register of some instruction instr (i.e %0 = icmp slt i32 %a, %b) you can do the following. Note that Instruction is a subclass of Value in LLVM.
std::string str;
llvm::raw_string_ostream instruction_name(str); instr->printAsOperand(instruction_name, false);
outs() << "The Name: " << instruction_name.str() << "\n";
// prints: %0
I ended up creating a function to run this operation whenever needed.
// Helper: Returns a value as its string virtual register representation
string valueToString(Value val) {
std::string str;
llvm::raw_string_ostream instruction_name(str);
val->printAsOperand(instruction_name, false);
return instruction_name.str();
}
Utilize Existing Passes
Just because we’re building an IR pass, doesn’t mean we can’t utilize existing ones! To remove trivially dead code it is important to understand the predecessor and successor blocks for a block of code you’re dealing with. I also had to conceptualize where PHI blocks could be used. For this, I found a graphical representation was very helpful. Luckily, one such pass in LLVM lets you do just that!
path/to/bin/opt -O0 -dot-cfg -mem2reg ./<your .ll file> -o result.ll
dot -Tpng .result.dot -o out.png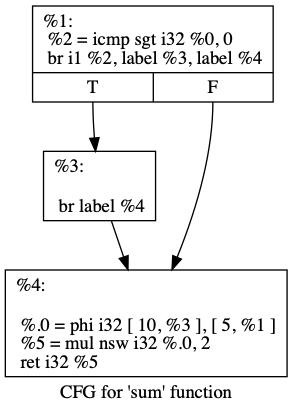
This photo is the output of the dot command above!
There’s plenty more useful built in Analysis and Transform Passes - I’ll let you take a look!
Encode line numbers into LLVM source
Debugging code is never fun. Debugging LLVM passes are really not fun. Thankfully the LLVM website has a giant page titled Source Level Debugging with LLVM - a page I appreciated a lot during this project. My favorite section was Object lifelines and Scoping, where it is explained how to encode line numbers into LLVM source from a compiled C program. This is amazing to me, and really demonstrates the power and extensibility of LLVM!
C++ “Debug” Mode
This is less an LLVM tip, and more so just a C++ tip in general. I had lots of print statements helping me debug my bitvectors along the way.
This is just a snippet of my debug messages…I know - a mess. It was, however, a good way to get feedback on the assignment and compare my output with what I expected to get after running the algorithm by hand.
...
...
============== USES/SUCCESSOR START ==================
0: var_uses: 0000000000 var_defs:0100000000 successors_instrs.: 0100000000
1: var_uses: 0100000000 var_defs:0010000000 successors_instrs.: 0010000000
2: var_uses: 1100000000 var_defs:0001000000 successors_instrs.: 0001000000
3: var_uses: 0001000000 var_defs:0000100000 successors_instrs.: 0000100000
[+++] Beginning to find successor for: 4
[---] %6 (instruction 5)
[---] %7 (instruction 6)
4: var_uses: 0000100000 var_defs:0000000000 successors_instrs.: 0000011000
[+++] Beginning to find successor for: 5
[---] %8 (instruction 7)
5: var_uses: 0000000000 var_defs:0000000000 successors_instrs.: 0000000100
[+++] Beginning to find successor for: 6
[---] %8 (instruction 7)
6: var_uses: 0000000000 var_defs:0000000000 successors_instrs.: 0000000100
7: var_uses: 0100000000 var_defs:0000010000 successors_instrs.: 0000000010
8: var_uses: 0000010000 var_defs:0000000000 successors_instrs.: 0000000000

============== USES/SUCCESSOR END =====================

============== CONVERGENCE LOOP START ==================
8: outSet: 0000000000 inSet: 0000010000
7: outSet: 0000010000 inSet: 0100000000
6: outSet: 0100000000 inSet: 0100000000
5: outSet: 0100000000 inSet: 0100000000
4: outSet: 0100000000 inSet: 0100100000
...
...
To suppress this output I utilized C++ macros. At the top of my .cpp file I placed:
// ===== COMMENT TO TOGGLE DEBUG MODE ======
#define DEBUGMODE
// =========================================

#ifdef DEBUGMODE
#define DEBUG_MSG(str) do { outs() << str; } while(false)
#else
#define DEBUG_MSG(str) do { } while (false)
#endif
All of my debug statements were wrapped in DEBUG_MSG()
...
DEBUG_MSG("[!] ERROR in varNameToBit with varName: "<< varName<<"\n");
...
and thus could easily be toggled on and off! There’s probably a more “correct” way to do this, but I found this solution simple and effective.
Have a comment? Join the discussion
This post helpful? Buy me a coffee!